US is in a recession, based on the last 2 employment reports and labor benchmark revisions. Most probably NFP was negative during several months in 2024 already. And it’s hardly positive right now. Asset prices, AI capex, and consumers willingness to reduce savings rate maintained aggregate growth of the economy. If current labor weakness spirals, there’s a problem.
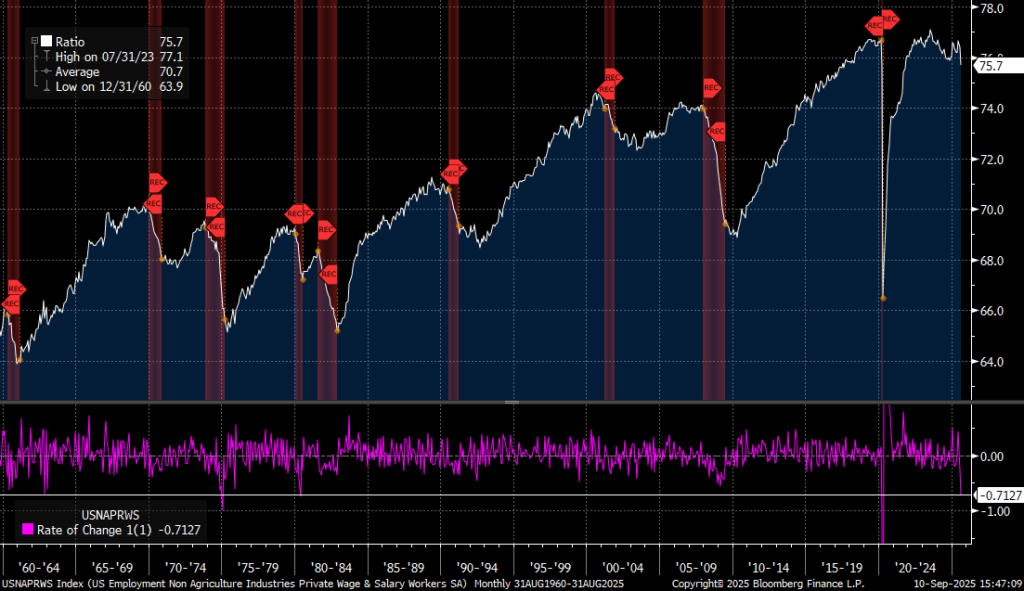
There were some extreme statistics recently pointing out to very weak labor market. The 1-month drop in private employment relative to labor force (70bp) is consistent with prior recessions. That’s Sahm Rule triggered in just 1 month.
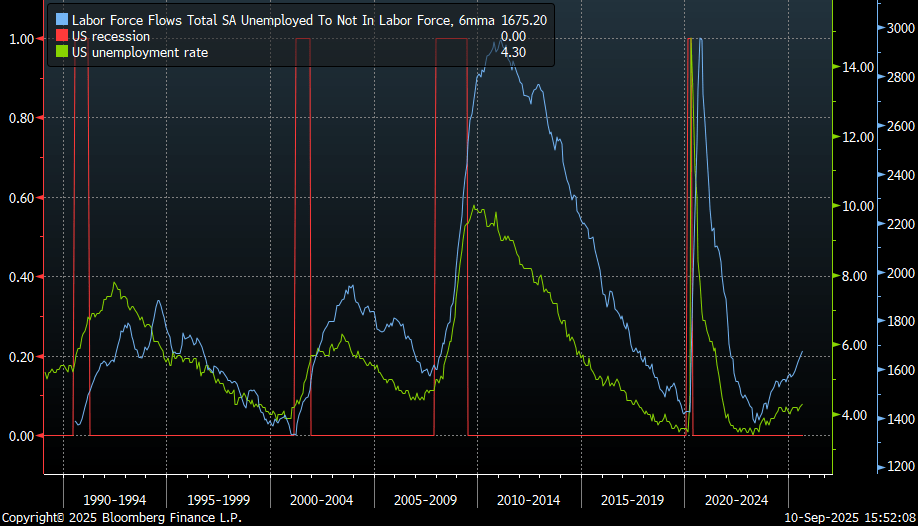
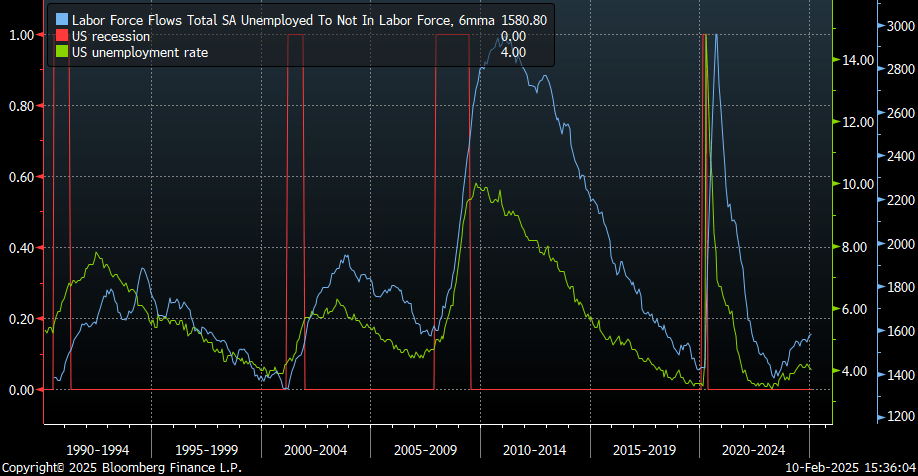
Flows of unemployed people out of labor force are accelerating. Finding a job is getting harder. And people give up faster.
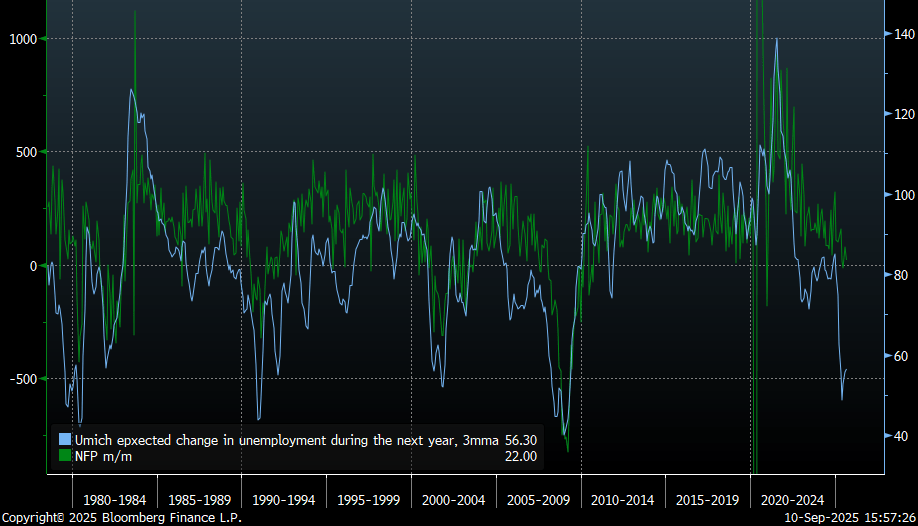
Household employment sentiment is seriously depressed as a result. Such level was historically associated with large job cuts arriving soon after.
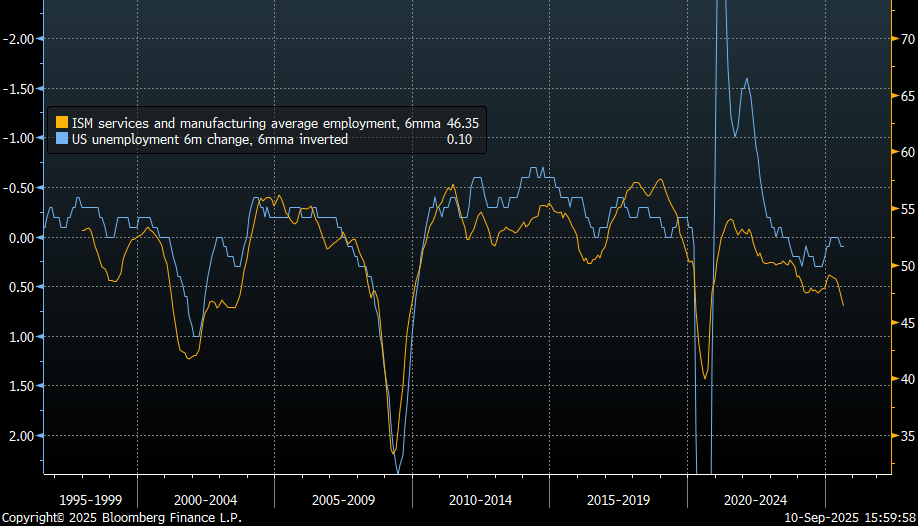
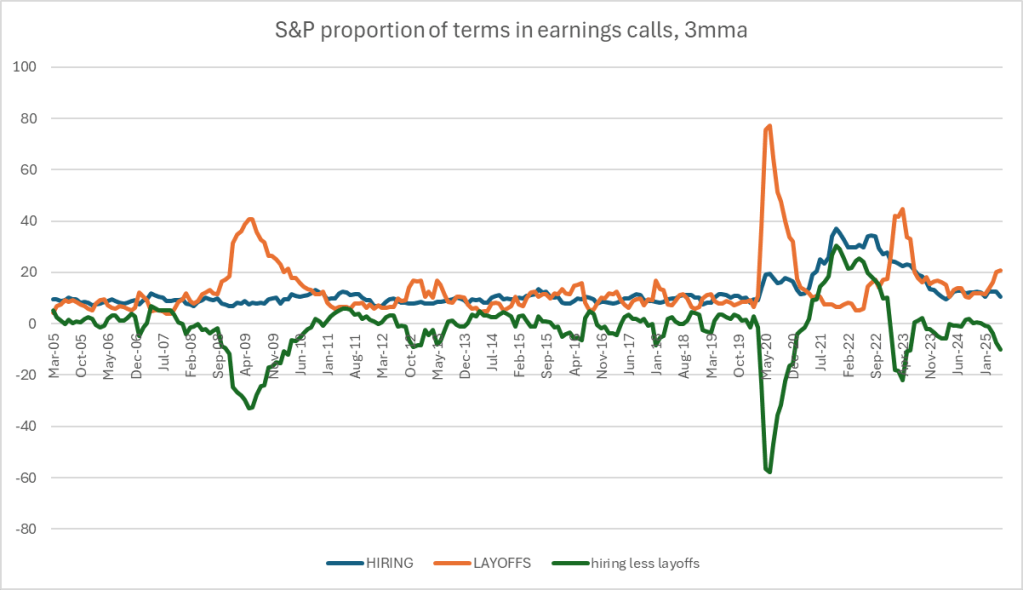
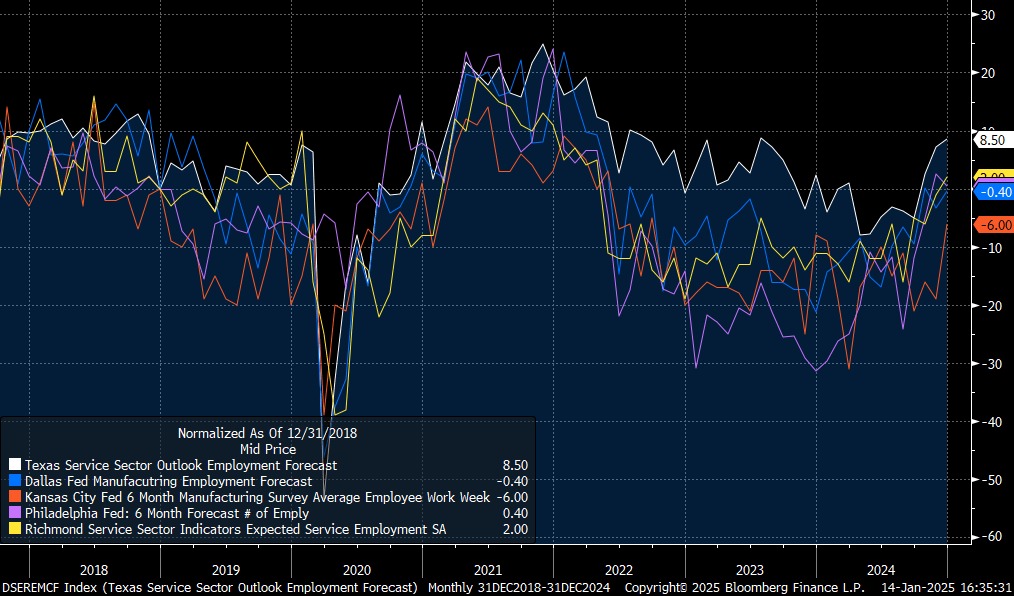
Not surprisingly, corporations are signaling faster reduction in employment as well.
And of course job creation revisions were significant second year in a row – another recessionary indicator.
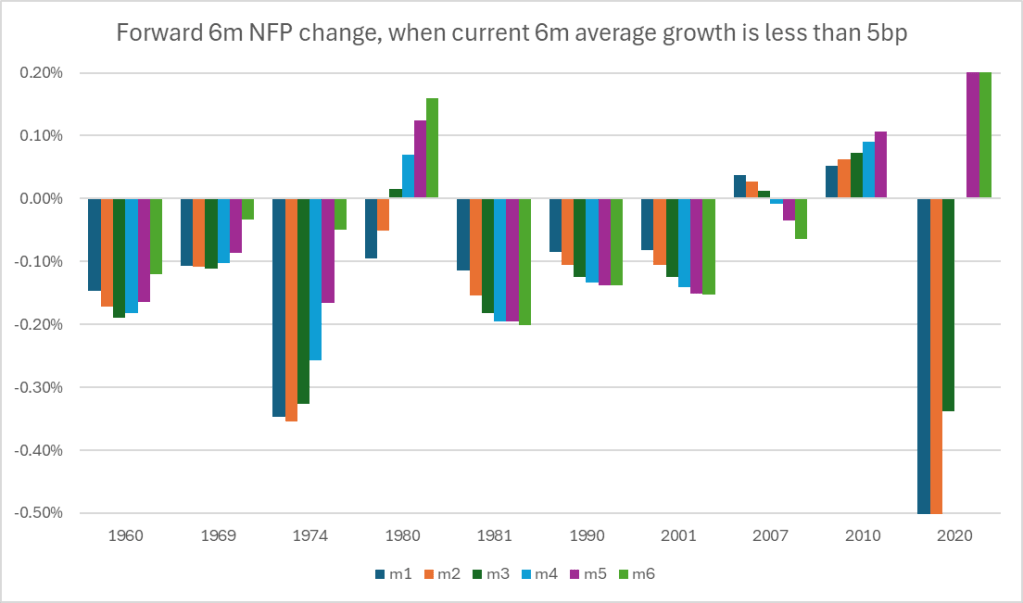
Given current 6-month rate of NFP growth, job losses usually accelerate and precede all previous recessions. 2010 was a false positive, when job market bottomed after similarly weak prints. When NFP growth slows to 0.05% over the last 6 months (as it is at the moment), average forward 6 months growth is -0.12%. I.e. NFP turns negative, layoffs are rising. That’s equivalent to 1-1.2mn of expected job losses over the next 6 months.
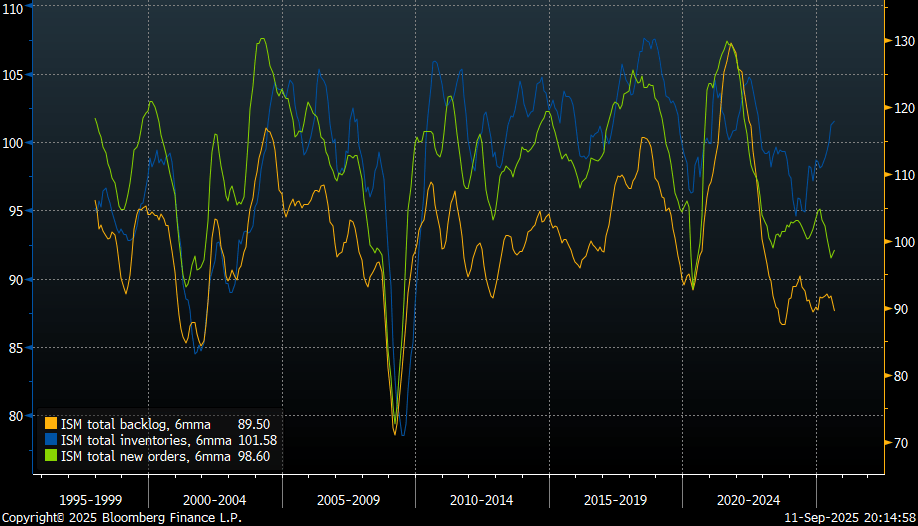
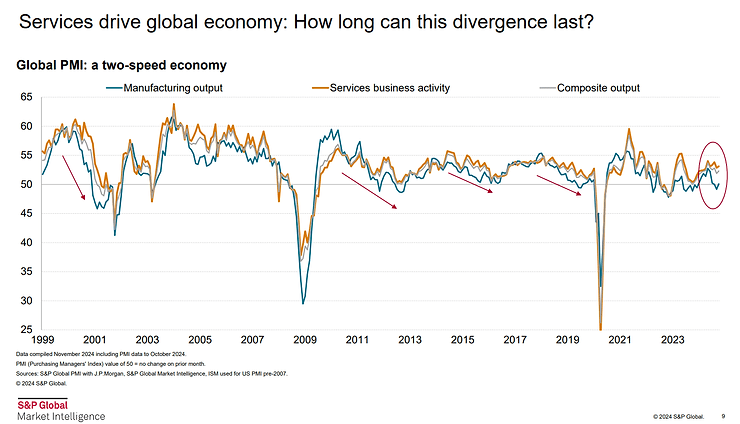
But is the cycle going to improve from here? Even though ISM orders were better in August, backlogs are still deteriorating and inventories are rising. Usually all three ISM components are synchronized.
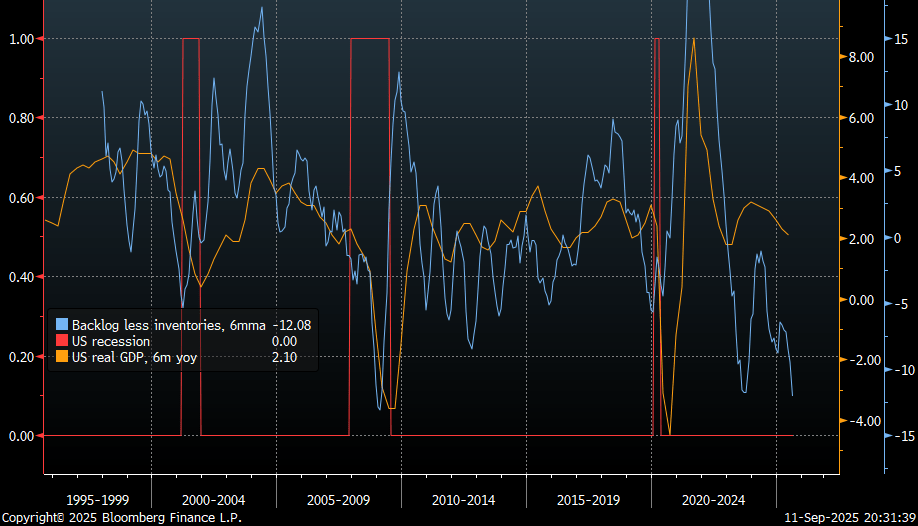
And when they diverge, that’s a bad sign for the economy, or the cycle direction at least. Orders aren’t translated into sustainably stronger backlogs at the moment. But companies are accumulating inventories in anticipation of better demand (and tariffs front running). What if orders stay low and inventories have to be sold out?
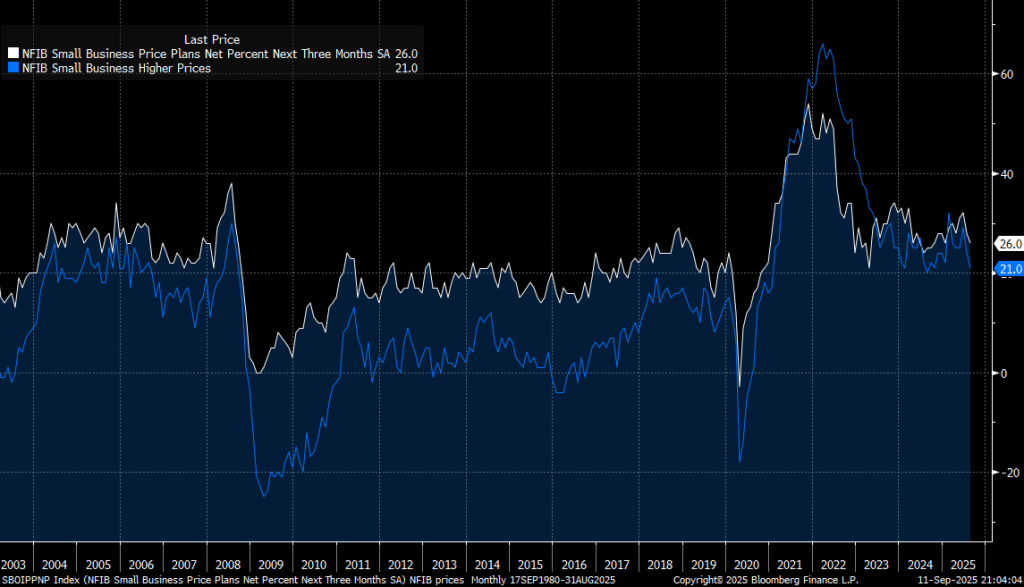
And what about inflation? It’s losing more steam, according to US small businesses. Tariffs impact has been marginal so far.
Inflation continues to miss expectations and labor market apparently has been weak since April, judging by the large NFP revisions. Tariffs prove to be a catalyst for a slowdown in US economy, but not in US (AI) stocks yet.
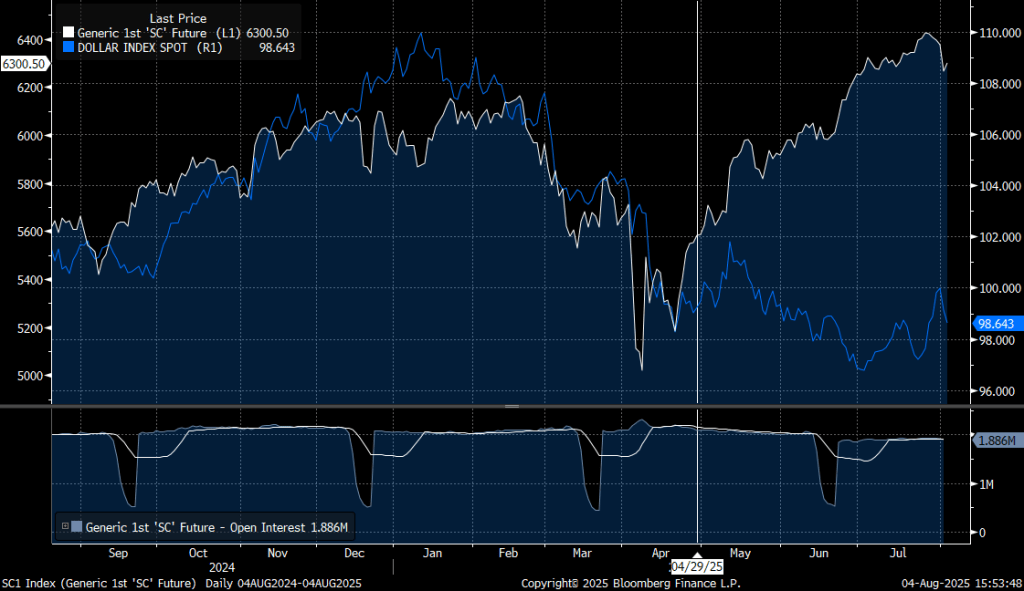
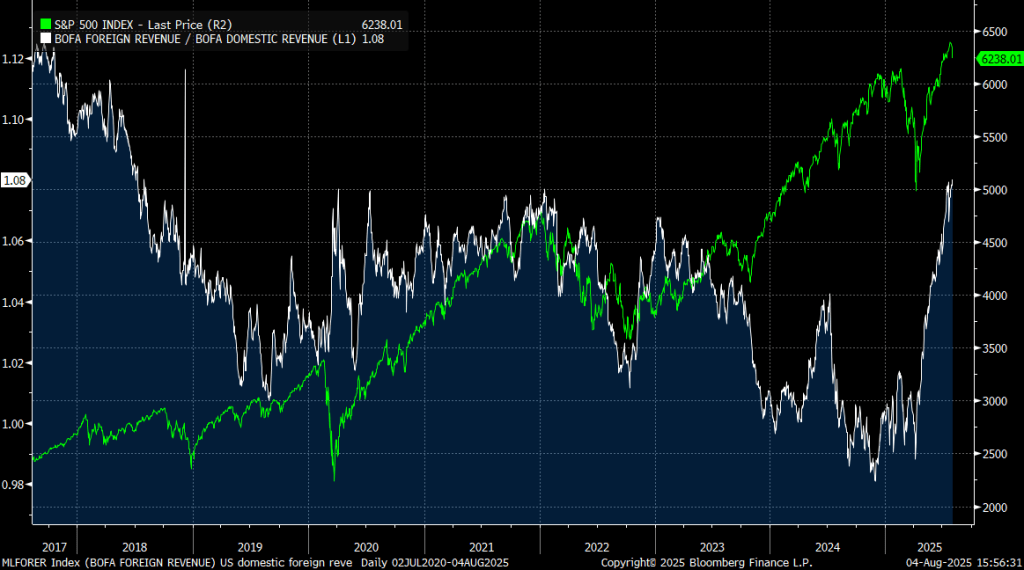
US companies report relatively healthy earnings, as dollar weakens and US avoids retaliatory export tariffs.
Exporters are leading the latest upward leg in US stocks. US Tech will probably avoid additional foreign taxes as well – as a part of the same deal.
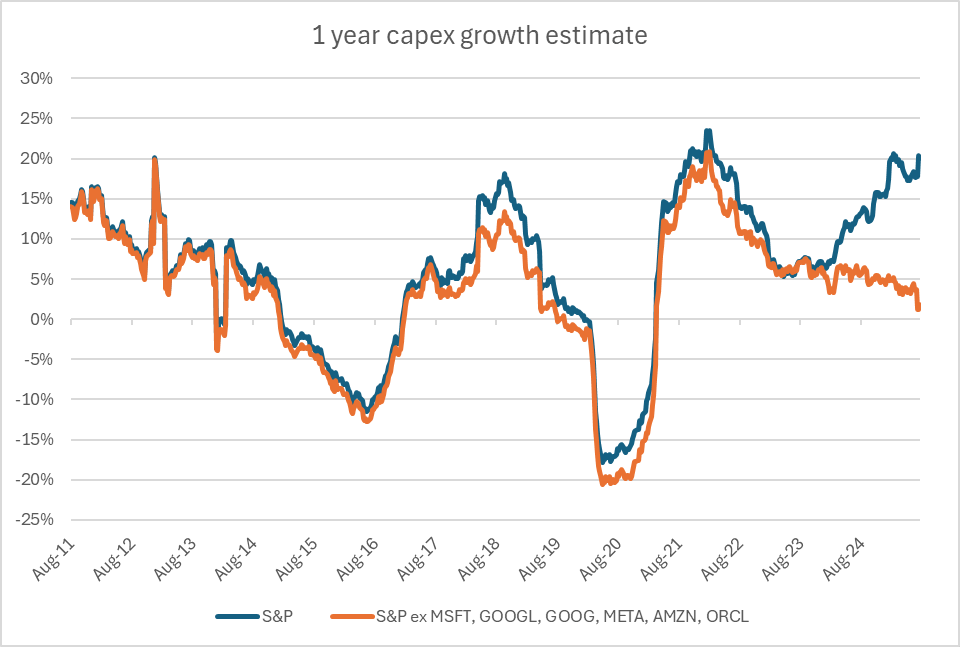
US Tech continues to expand AI capex, while the rest of the S&P 500 index is reducing capex growth to almost 0. Compositionally that’s not great for the labor market going forward, since big tech basically stopped hiring after Covid, but other business didn’t.
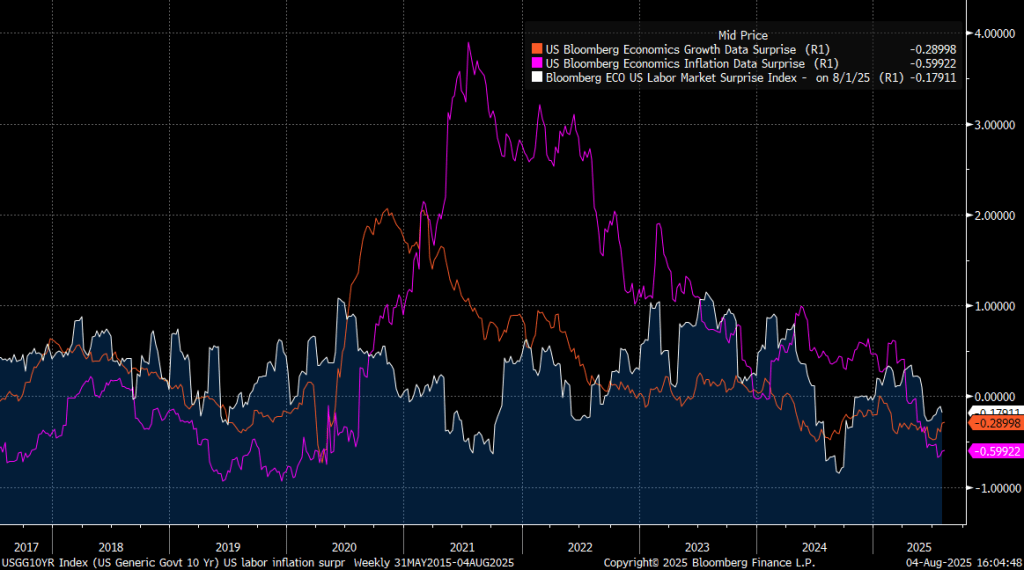
At the same time US economic data continues to surprise negatively on aggregate. Growth, labor, inflation – weaker than expected.
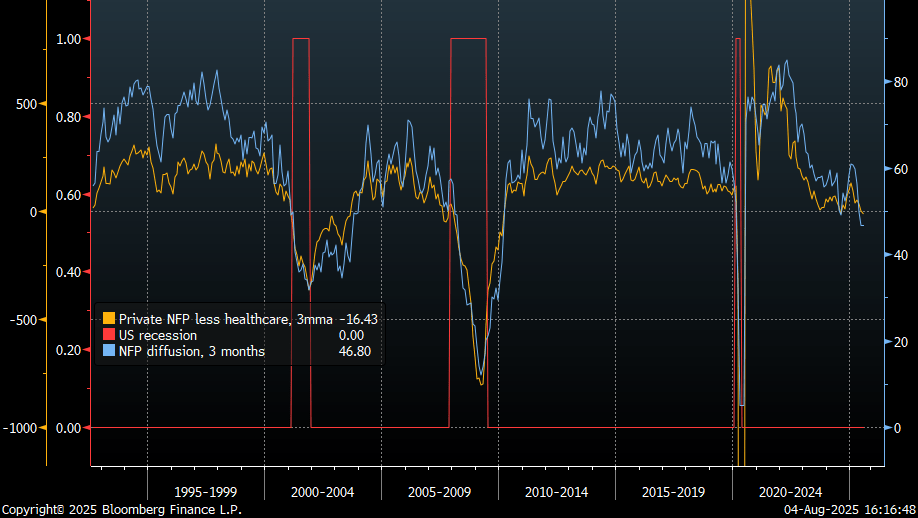
All three parts of the economy continue to slowdown. Labor is contracting now.
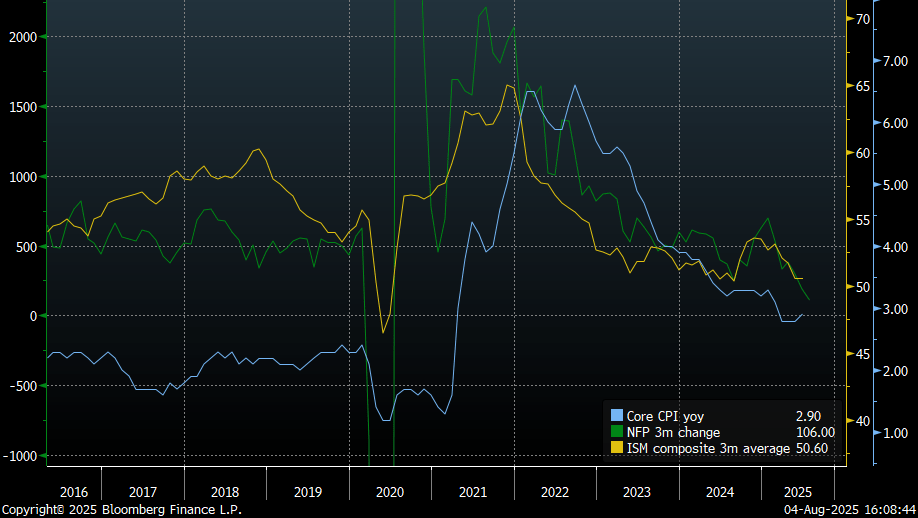
Absolute number of NFP jobs created as well as jobs breadth has deteriorated substantially – now also worse than in summer 2024 and in line with recessions.
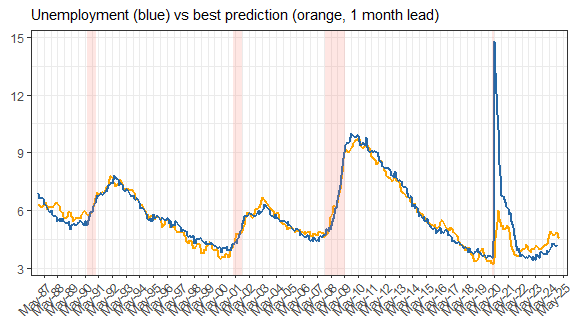
Unemployment, including people who are not in the labor force but want a job, is rising at the similar trend as in the last couple of years. Albeit slower than in 2000 and 2008, as layoffs are still low. AI hasn’t altered the trajectory yet.
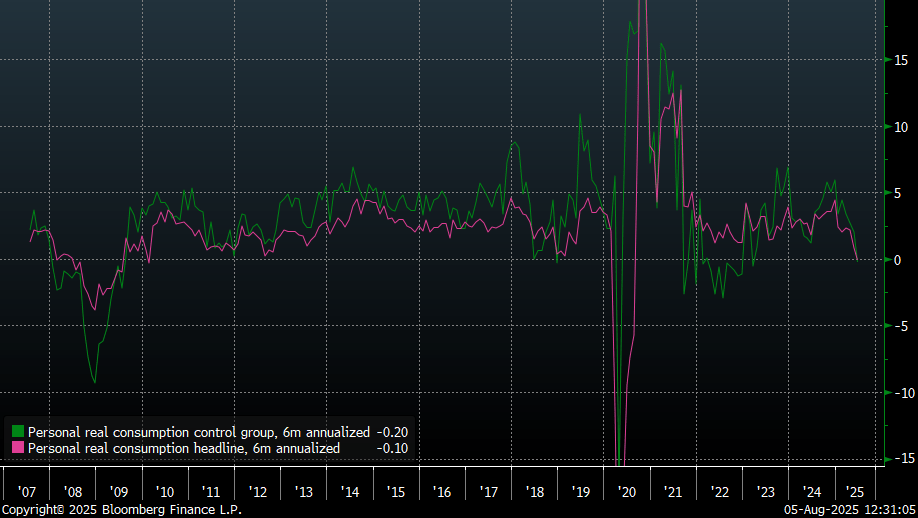
US personal consumption slowed down substantially this year as well. Household are saving more, as labor market uncertainty is rising. And number of jobs is declining.
There are signs of AI cycle slowing down from here too, despite ever rising capex plans. While Taiwanese orders and exports are booming, soft leading indicators are souring.
Central bank easing options continue to look attractive. Long term yield found some resistance, making duration more favorable. DM equities are facing downside risks, as export economies will suffer from the “trade deals”, and in US consumer is losing steam.
Trump’s big beautiful bill is negligible in terms of economic impulse. Accompanied by 10-12% average tariffs the whole policy change is contractionary. Inflation can undershoot expectations due to continuing disinflation in shelter and services. Earnings and employment should suffer more.
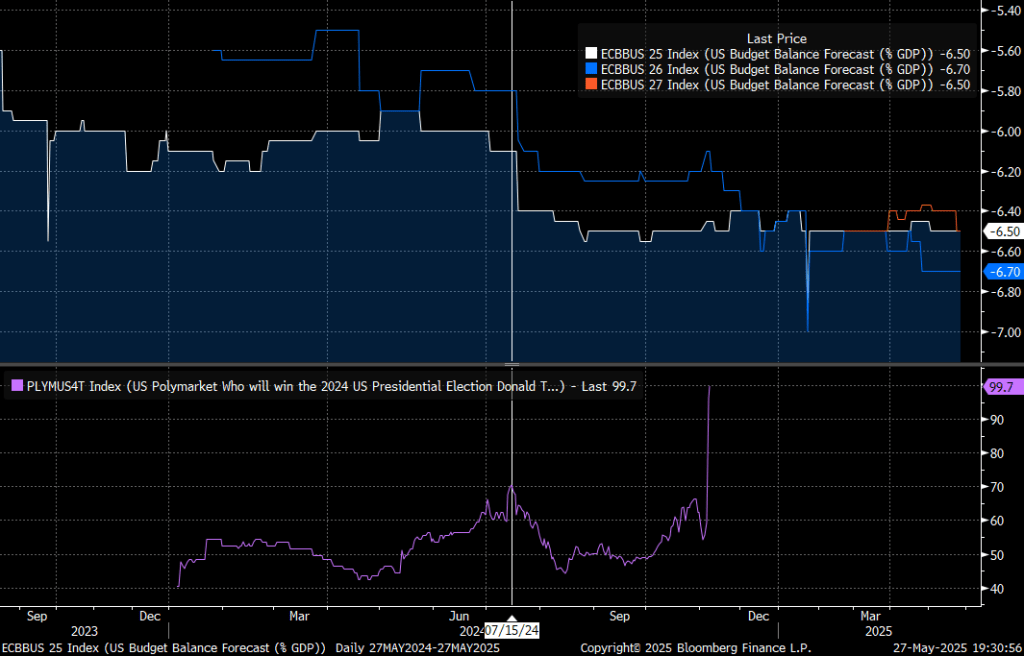
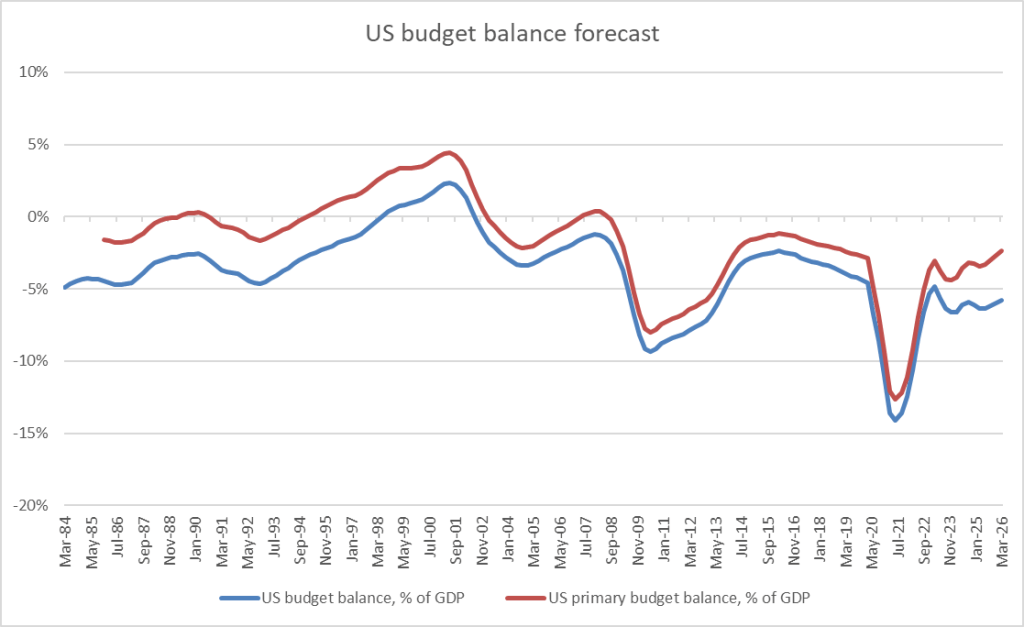
Despite all the bill headlines, economists haven’t altered their fiscal forecasts since Trump started leading the polls in summer 2024. Apart from frontloaded corporate investment tax deduction, aggregate impulse of the bill is absent.
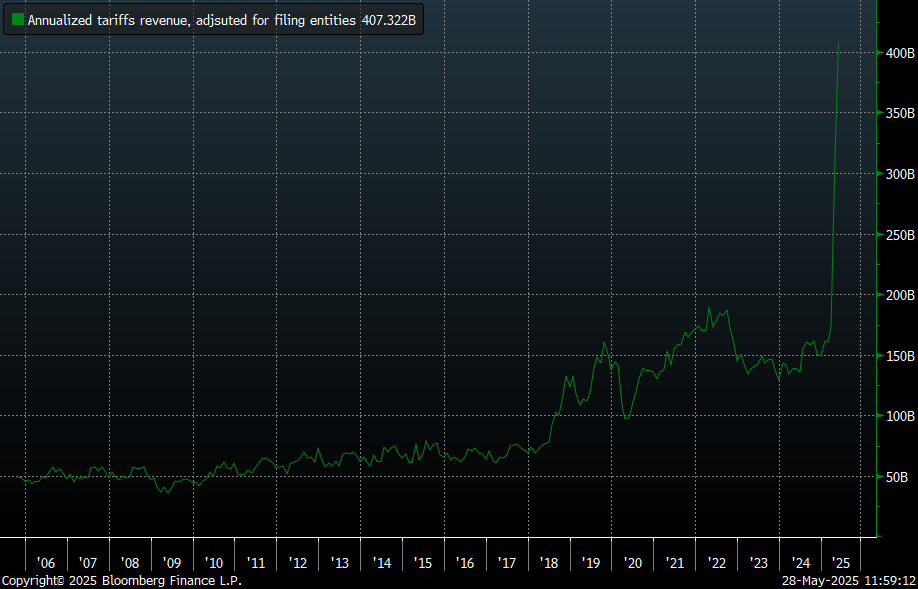
Meanwhile April tariffs revenue (or cost to importers) was around $22bn. Annualized and adjusted for number of companies that file monthly (2/3 of total) it is around $400bn: 10% of imports or 1.5% of GDP. This new source of fiscal tightening is effectively reducing government deficit to 5.0-5.5% from 6.5% projected.
At the same time, interest expense is the quickest growing government cost, contributing 3-3.5% of GDP to the deficit.
Netting both tariffs and interest, primary deficit is expected to decline to around 2.5% in a year, assuming effective 10% tariffs on all imports. From ~3.5% at the moment.
Inflation can undershoot elevated tariff-caused expectations, as wages are slowing, services inflation is normalizing and housing market is rolling over, negatively affecting shelter part of the CPI. Initial reciprocal tariffs was a surprise. However, once negotiations started, expectations started to moderate. FED, meanwhile, is in the wait and see mode.
Actual shelter inflation is half of official numbers, which contributes 1.4pp to official 2.3% yoy CPI. Adjusting for the lag, headline CPI is around 1.5% at the moment.
Median services inflation is moderating. Companies are adjusting prices slower than in the last 3 years. But still more than before Covid.
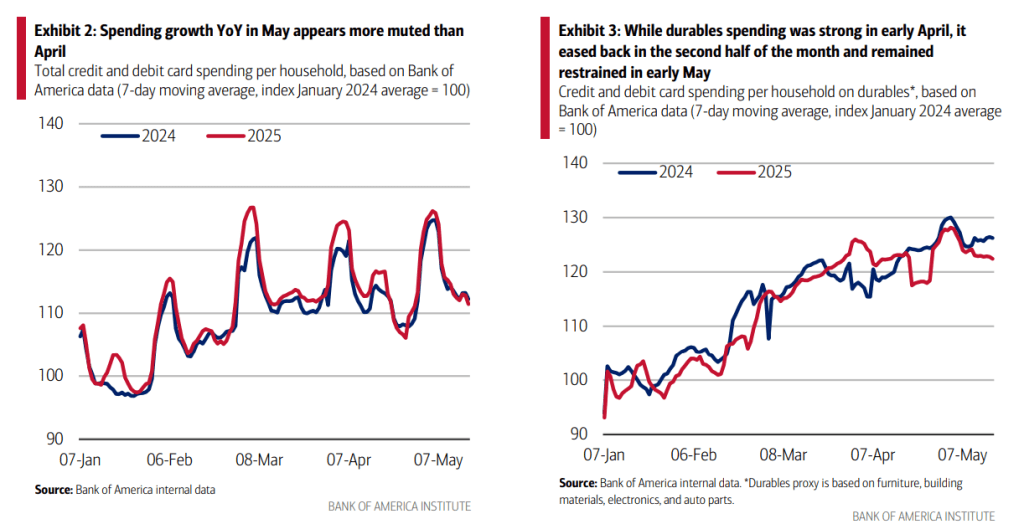
Moving to growth, consumer spending still remains robust but is driven by tariffs front running. Car sales are already expected to decline in May from strong March and April figures.
Demand weakness is mentioned more often during corporate earning calls.
This is also translating into weaker labor market. S&P employment sentiment dropped in April and May, probably still affected by DOGE headlines. But sharp tariffs announcement didn’t help either.
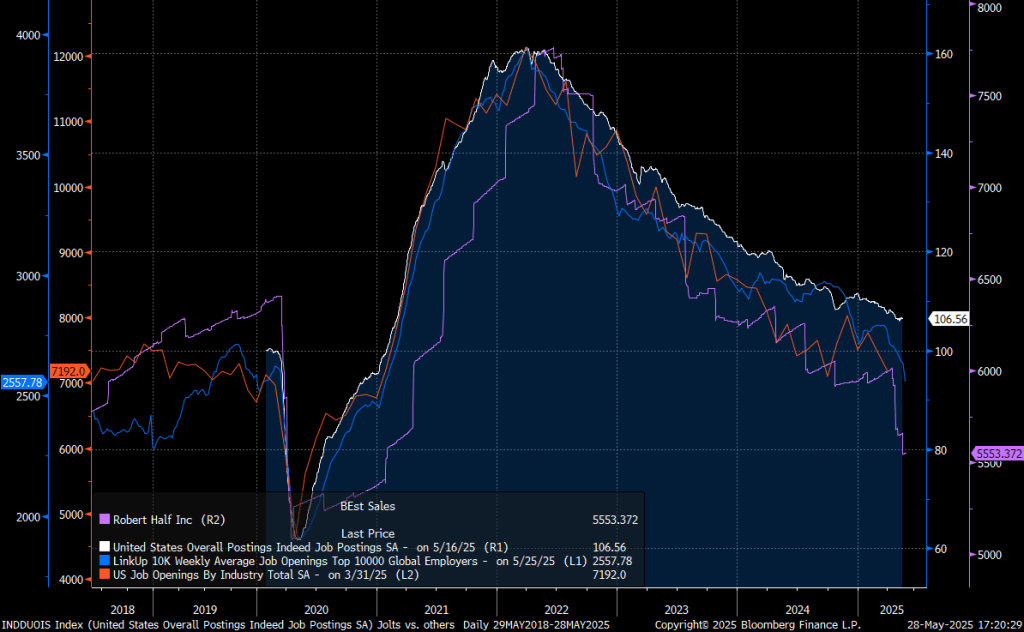
Job postings continue to deteriorate and haven’t improved since trade talks started.
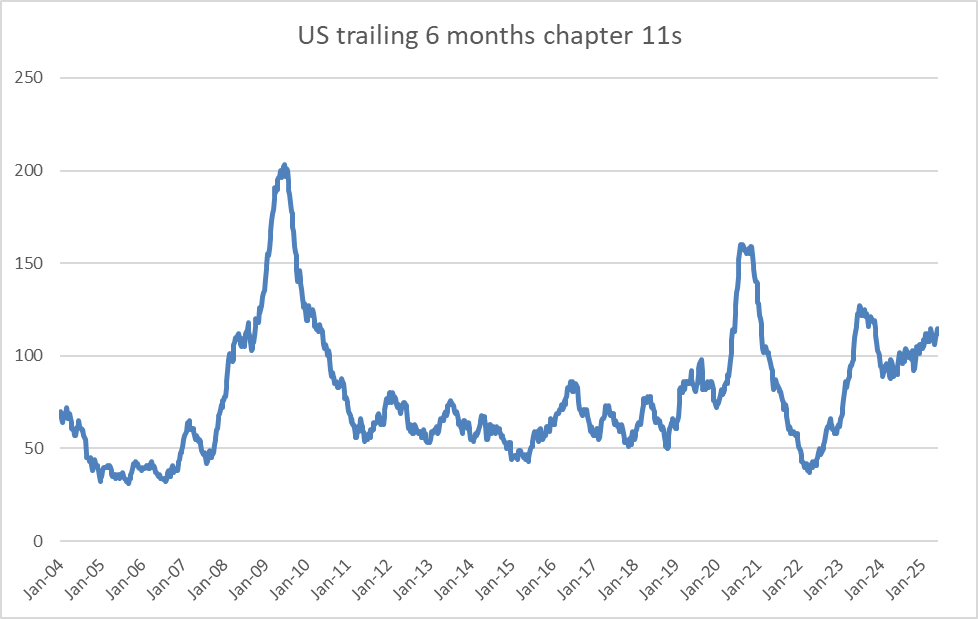
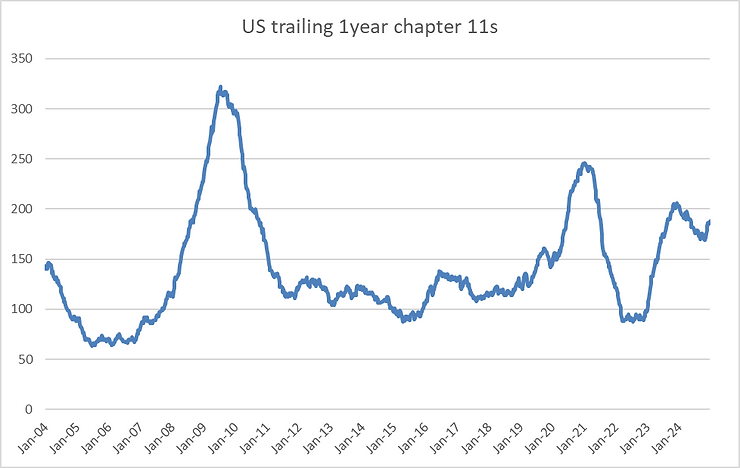
Chapter 11 filings are slowly trending higher. Putting extra pressure on unemployment.
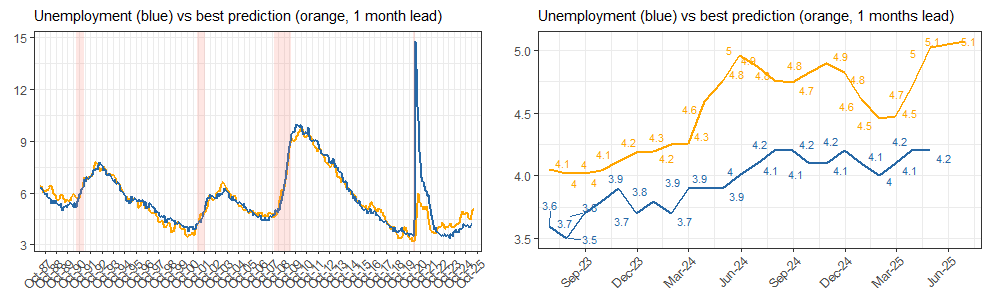
Unemployment expectations are rising again after a dip in Q1.
These all adds to the political risks that US assets are facing. To my mind, it creates attractive opportunities in Fed easing expectations through SOFR calls. US equities face more downside, particularly after the “liberation day” bounce. Low price long term bonds have interesting risk/reward profile, as they should still work in a recessionary scenario.
Newly released economic data out of US is rolling over quickly. At first glance, Trump tariff policy and Doge employment actions are raising uncertainty and reducing activity. In fact, economy has already been showing topping signs for a while. Lack of layoffs and aggregate corporate earnings were key pillars of the current cycle. But this might be unwinding at the moment.
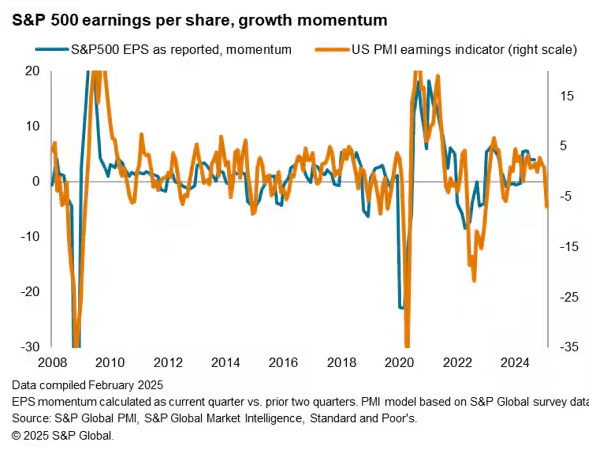
Corporate earnings are now facing downside risks, according to S&P.
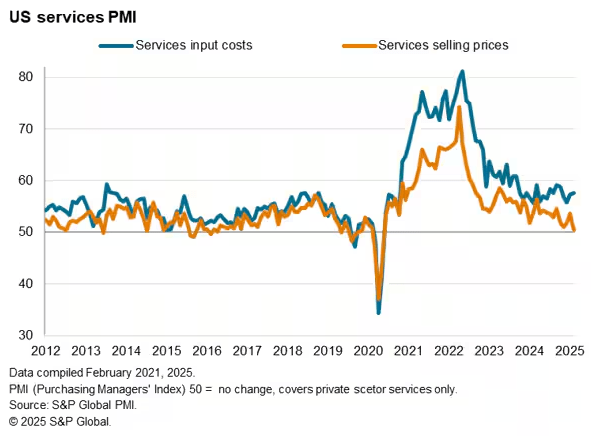
As service companies aren’t able to raise prices anymore.
Diffusion of earnings-per-share expectations has been deteriorating. More S&P sectors are expected to have declining earnings over the next 12 months. This can trigger a sell off in equities.
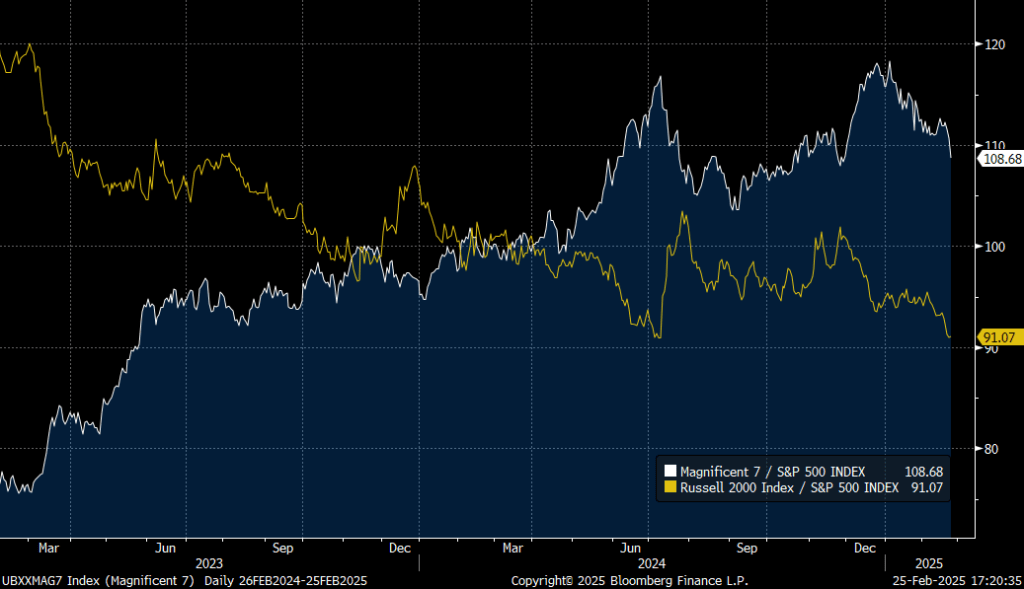
Largecap AI story is not only shaken by the Deepseek news, but by new potential reversal in activity: “Microsoft Corp. has canceled some leases for US data center capacity, according to TD Cowen, raising broader concerns over whether it’s securing more AI computing capacity than it needs in the long term.” Now both small caps and the Magnificent 7 are underperforming the broader market.
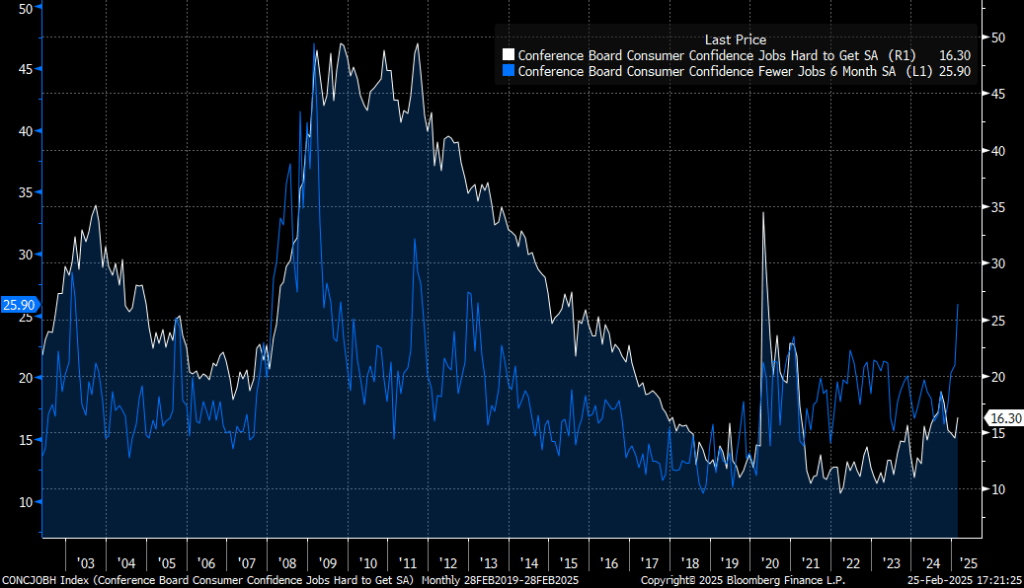
Consumer is showing more weakness signs. Weak retail sales were accompanied by poor Walmart guidance. Conference board consumer confidence is flashing red unemployment signs.
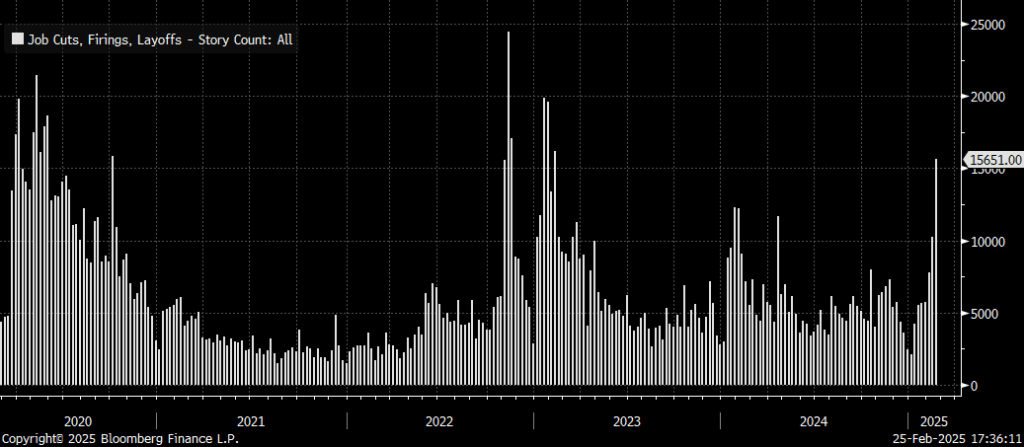
Number of “layoffs” mentions in the news articles is spiking again.
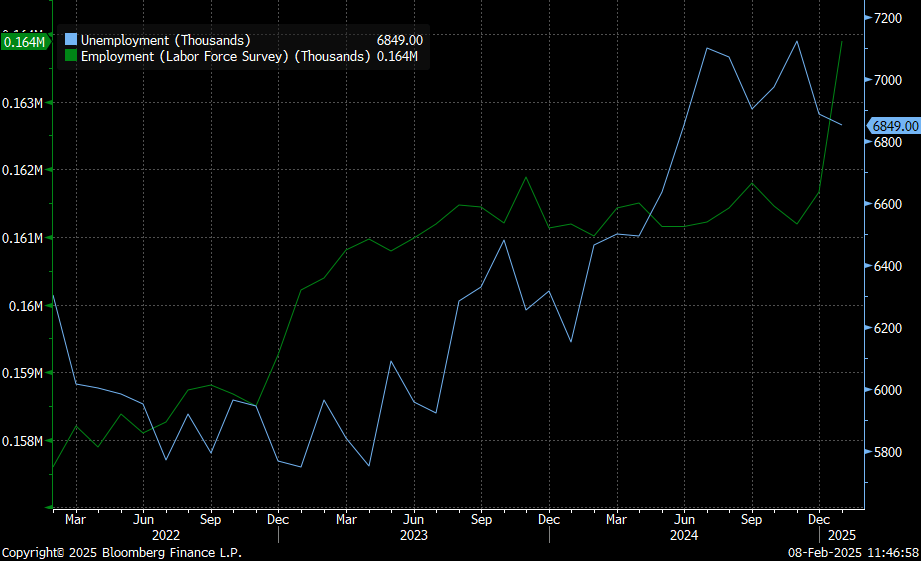
A lot of labor market stuff has been revised since the last post. Most importantly the household survey employment was raised by 2.2 million, the same as the labor force, meaning CPS under counted number of people employed substantially in 2024. Adjusted for the population control, BLS says unemployment rate would have been lower by 20 basis points and a number of people unemployed would decline by 142k.
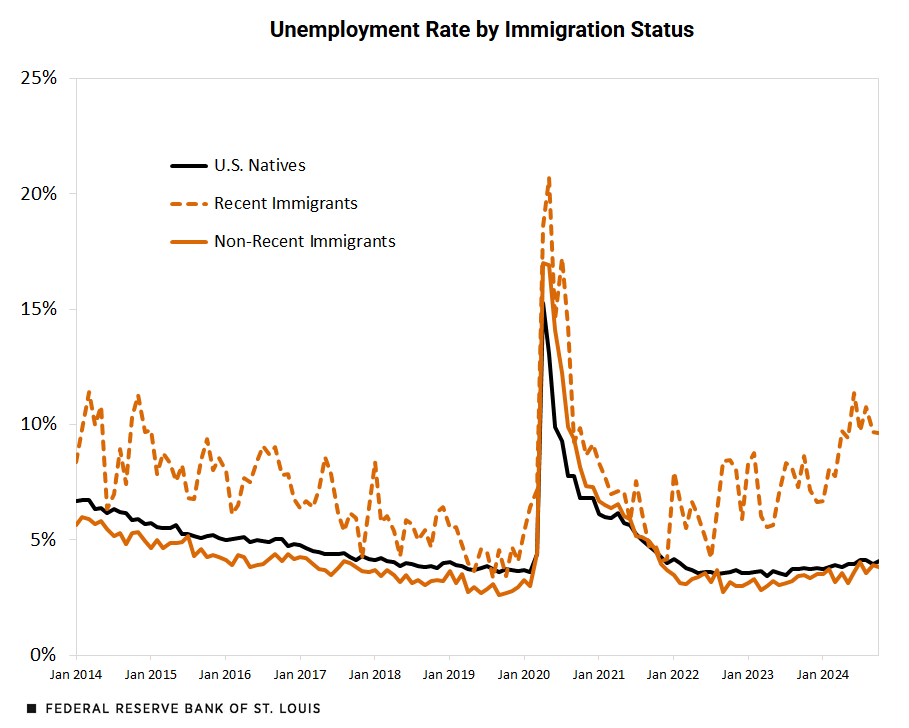
The population control effect implies unaccounted workers sample has only marginally higher unemployment rate than entire population, which can be too optimistic. In fact, recent immigrants have much higher (around 10%) and faster rising unemployment rate than local population, according to St Louis Fed.
At the same time, flows into employment stay weak for people who are out of the labor force.
Unemployed people are more likely to leave the labor force as well. The trend has been consistent with rising unemployment rate in the past, with an exception of the 1993-1995 period.
Moving to establishment survey details, private NFP less healthcare increased by 45k in January. Retail employment again was unusually strong, and didn’t reverse as expected, adding 34k of jobs. But tariffs front running is still probably the main driver of the growth.
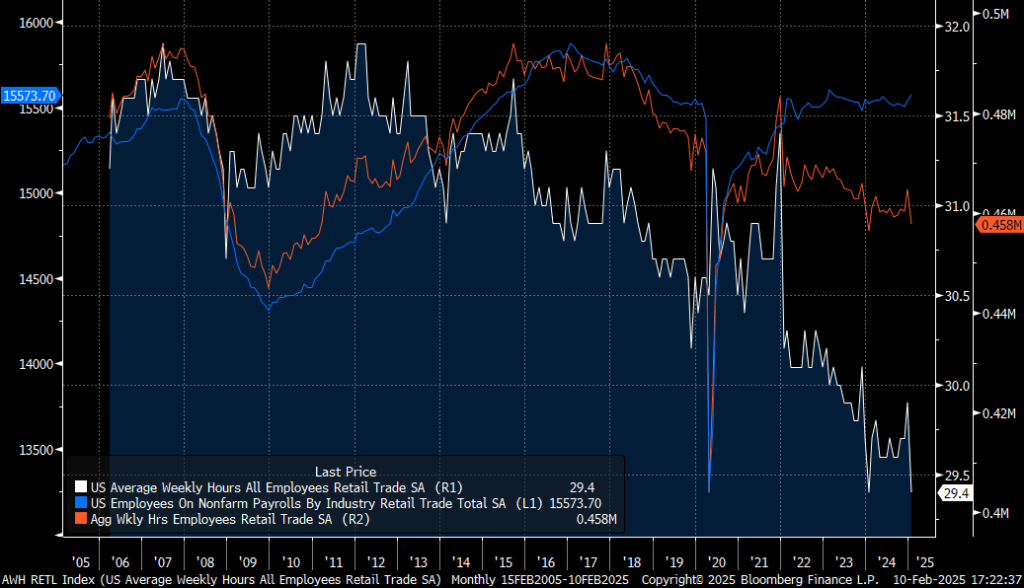
Moreover, while retail NFP was strong, working hours in retail dropped to the previous all time low. Aggregate working hours are trending down too. And the sector employment should be converging lower in the future.
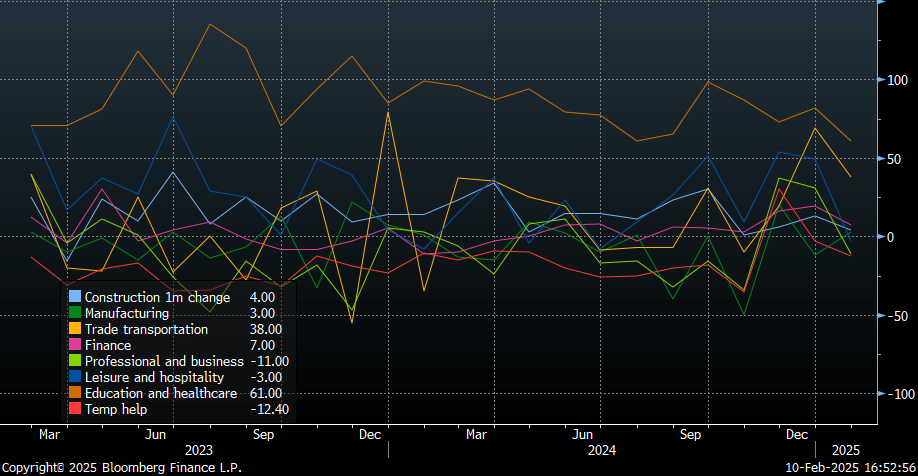
Overall NFP employment breadth deteriorated in January, with all categories but manufacturing posting worse month-over-month growth. November-December bounce could still be related to post-election hiring backlogs.
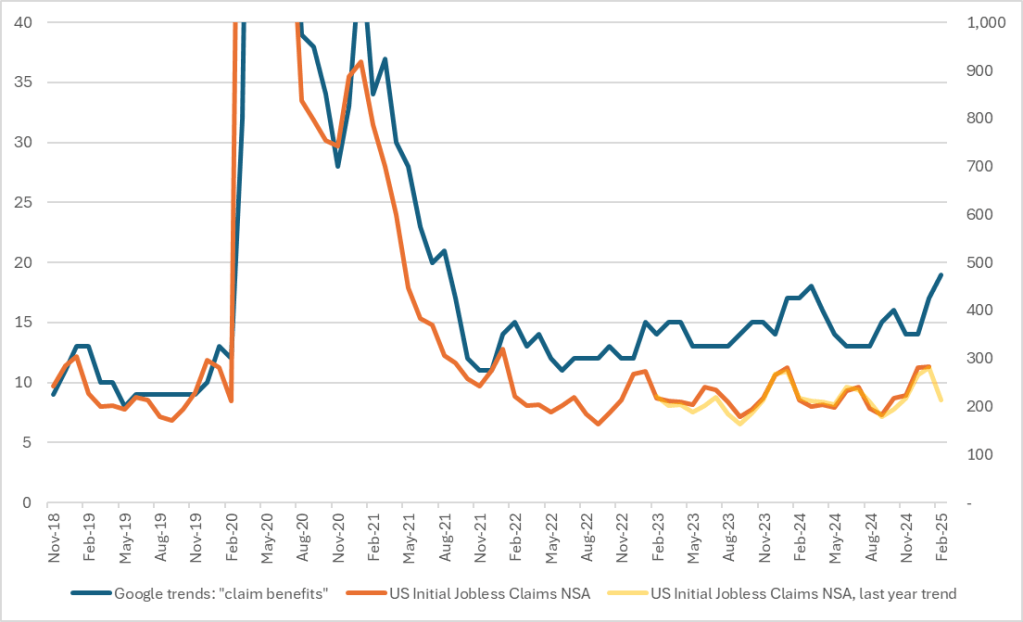
Federal spending freeze is already having an effect on contractors. Unemployment claims will have to start rising again. Some signs are visible in the Google Trends data already.
Small businesses continue to cut labor demand. All in all things are setting up for a bottom in the unemployment rate.
US labor market momentum improved strongly in December after higher than expected non-farm payrolls and lower unemployment. Retail trade seasonal increase in employment was registered in December due to the calendar effects. And firms probably cleared hiring backlogs after the election results. Both will be a drag in the next reports.
Is labor market reversing and accelerating again? Doubtfully. Many labor indicators are mixed. Some, which are mostly based on corporate expectations, are improving. Others, more actual, are stable or weaker. Unemployment run rate is around 4.5% at the moment, based on various regressions. Risks of the higher unemployment rate remain.
To begin, actual flow of people not in labor force to employment is declining further. But people remain employed longer compared to previous labor softening cycles, judging by employed-to-employed flows.
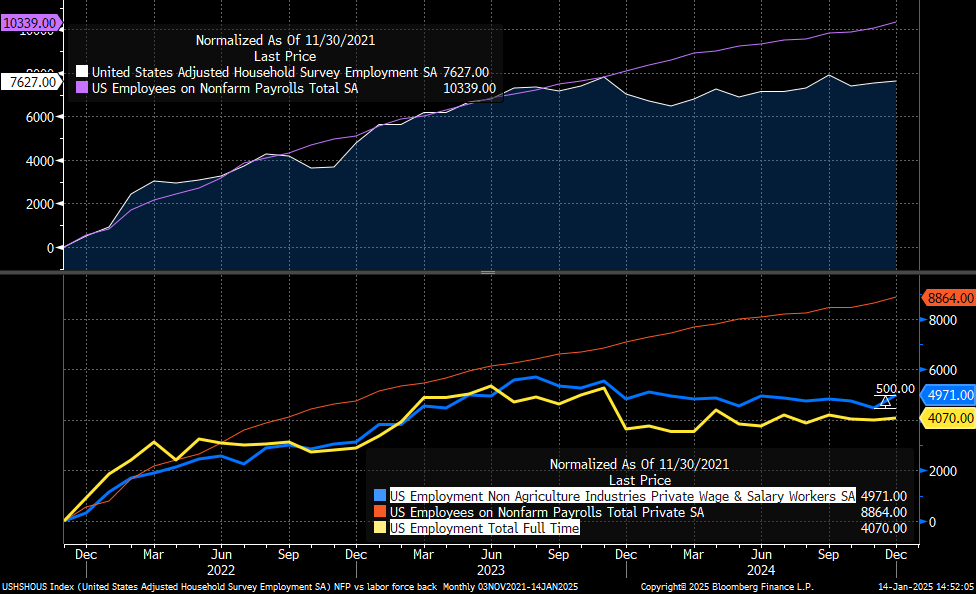
Household survey registered a strong increase in private employment in December: +500k of private non agriculture jobs. Nonetheless, full time employment has barely moved. Household survey is further diverging from NFP.
Both NFP and household surveys was also significantly affected by retail sales jobs. NFP retail trade category increased by 49k m/m. Household survey “sales and related” jumped by more than 500k on a seasonally adjusted basis. Some of that could be given back in the next reports.
Moving to alternative indicators, University of Michigan consumer expectations of 1-year unemployment deteriorated significantly in January. Current level, especially its 6-month moving average, isn’t always indicative of recessions, but it’s also much worse than in January 2017, the first Trump’s January.
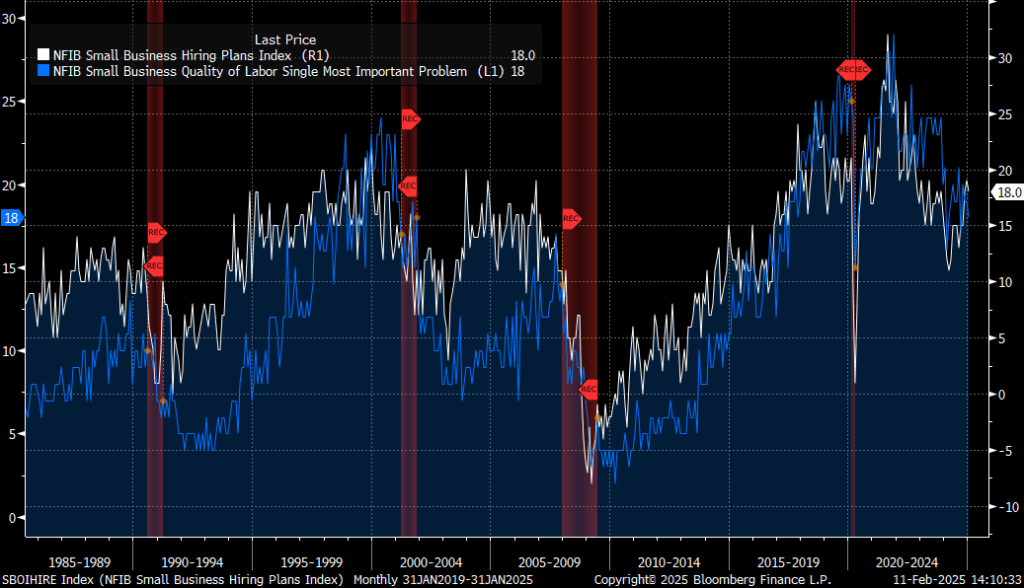
While NFIB small businesses hiring plans jump, similarly to other NFIB expectations sub-components. This is similar to the first Trump term as well.
Hiring expectations are also stronger in a number of other regional Fed surveys.
But actual change in employment per firm, according to NFIB, is down to a new cycle low.
And a lower number of firms is raising wages now, which usually happens in a weaker labor market, with unemployment closer to 4.5% (based on a simple regression with pre-Covid sample).
We’ll see whether expectations will affect current behavior, or just mislead about the reacceleration narrative. Risks of higher unemployment rate stay high.
Risk of US recession is increasing: tariffs reduce aggregate demand, housing market is deflating, business capex set to decline after IRA and AI boost, personal consumption will slowdown due to higher unemployment rate and weaker wealth effect, fiscal impulse disappears. S&P and risk assets fall, but not because of higher rates. As Fed turns dovish, 2 year yields rally.
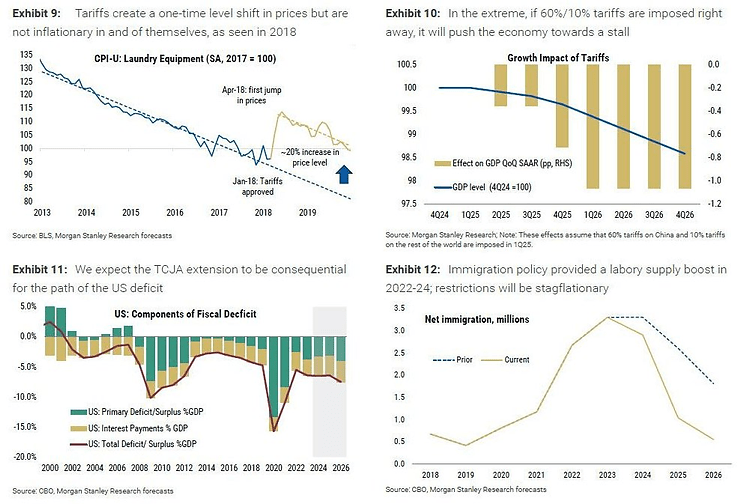
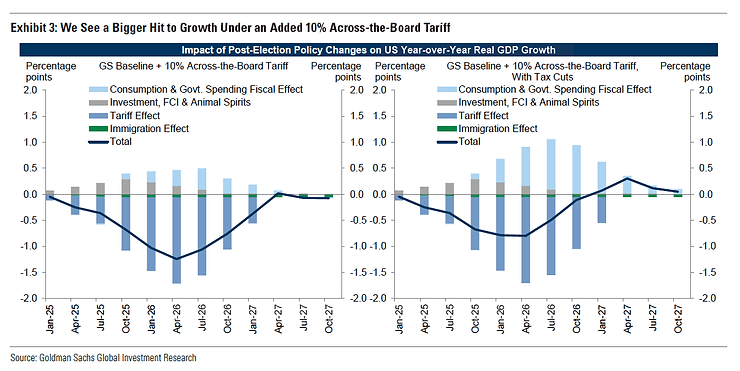
Tariffs. US GDP will drop due to higher costs and lower demand, offset by corporate tax cuts, and prices inside the US will jump again. But it will help with deflation outside of the US.
Estimates of GDP decline vary across economists, but conclusion is similar. US will require substantial fiscal stimulus to diminish negative effect from tariffs.
Moreover, the first round of tariffs had negative cumulative effect on US employment mostly due to rising import costs and foreign retaliation, according to Fed.
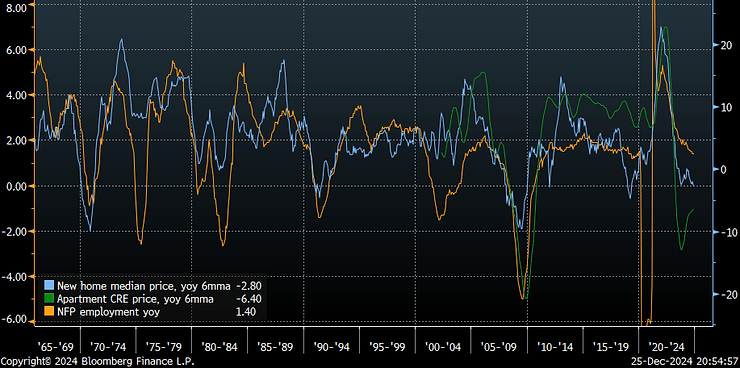
Housing market. Number of houses for sale is rising quickly at moment, even when normalized by actual number of new homes sold. This kind of inventory accumulation was associated with prior recessions and falls in general employment.
As a result deflation in housing is spreading. Implications for general inflation are also negative.
Business capex. Nonresidential construction planning (AI data centers, offices, warehouses, retail etc) is slowing down.
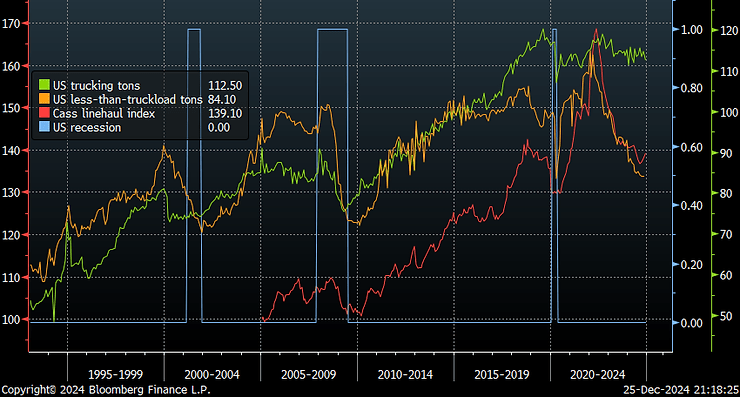
US trucking remains in recession, as commercial capex ex AI has been slowing down since early 2023.
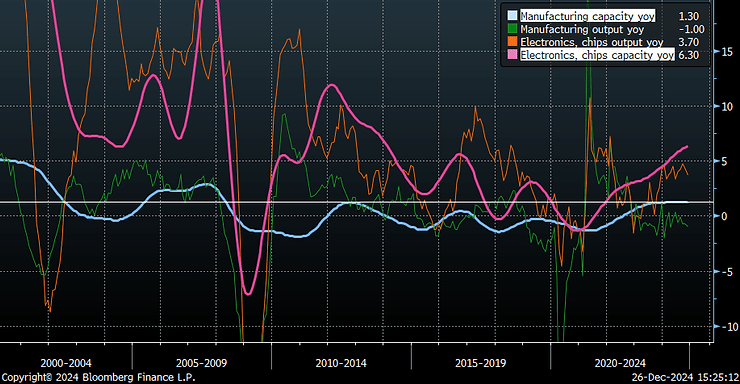
US manufacturing capacity is growing at 1.5% yoy, the fastest pace since 2012. Electronics (including semis) capacity is growing at much faster 6.3% yoy. But overall manufacturing output is down 1% yoy and has been lagging capacity expansion for 2 years now.
The lack of manufacturing output growth leads to declines in capacity utilization and higher unemployment historically. This is usually followed by long business capex slowdowns.
Unemployment. Employment intention proxies remain weak. At the moment there’s no boost expected from any of the Trump policies, according to soft indicators.
Consumer and small businesses surveys are consistent with unemployment of around 4.5-4.6% at the moment.
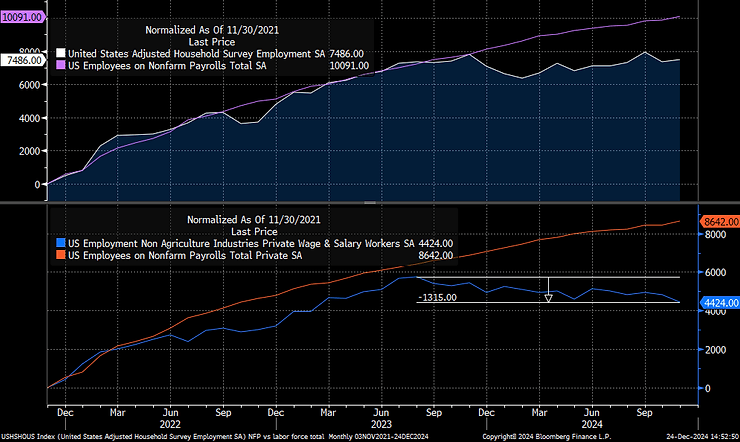
Private employment lost 1.3mn of jobs in the last year and a half, according to household survey. Total private household employment is up 4.4mn in the last 3 years. That compares to 10mn of private and public jobs added, according to NFP survey.
Wealth effect. S&P returned roughly 26% in 2024, one of the largest amounts in the last 30 years. Average S&P return during this period was 8.5%.
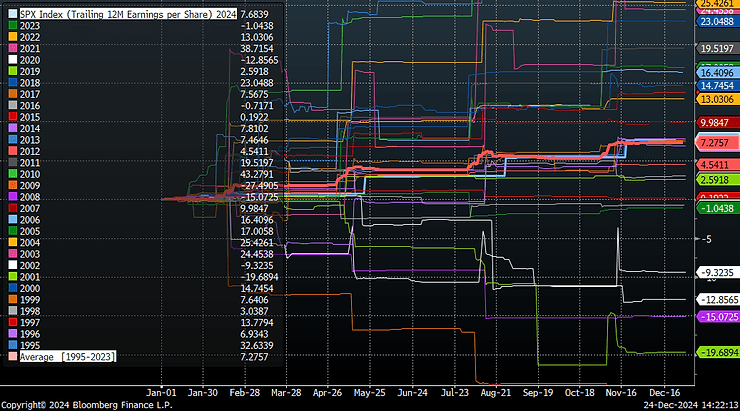
At the same time, trailing 12 months EPS is up 7.7% this year, marginally above average 7.3%.
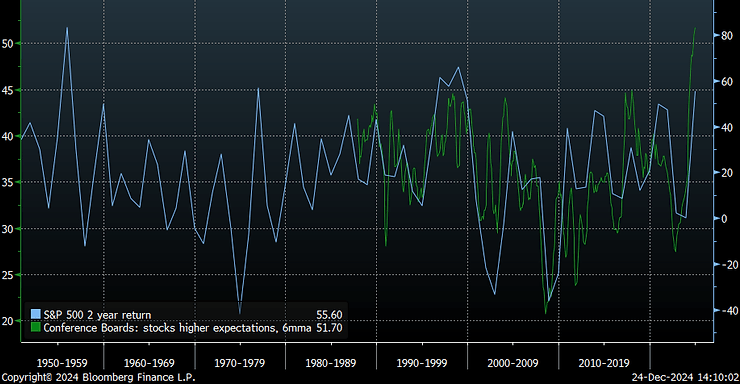
The index jumped 55% over the last 2 years – one of the best runs ever. That unsurprisingly entrenched into most recent consumer expectations and boosted actual net worth.
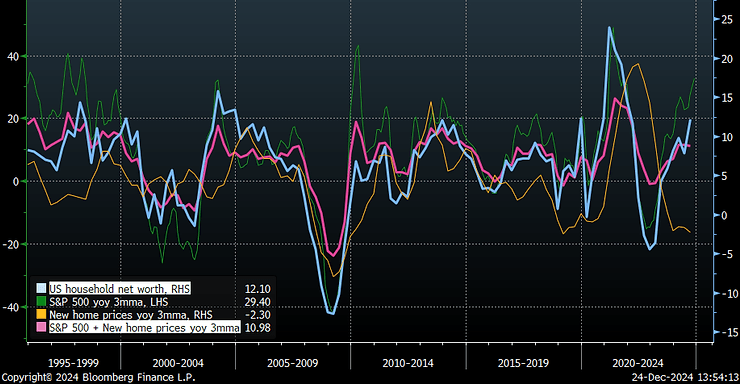
US households net worth is rising at around 12% yoy at the moment. This is roughly in line with an average of S&P returns and new home prices. While housing is already peaking and prices are declining, stock market (and Bitcoin) is maintaining strong wealth effect for households. Unfortunately, the current ramp up in net worth is not driven by owning companies, that generate excess business returns but to a large extent is a result of equity multiples expansion.
Fiscal impulse. Economists expects US budget deficit to remain at 6.5% over 2024-2026, and government debt to add 4.5% of GDP during the period. Fiscal impulse will again recede to zero in this scenario after roughly $1.2tn of incremental impulse since 2022.
US GDP significantly decelerated in 2022 in line with tighter fiscal policy. But later reaccelerated again. Excluding some idiosyncratic contributions like Ozempic, or Boeing output fluctuations, or defense contracts, US GDP is already slowing from 2023 average pace.
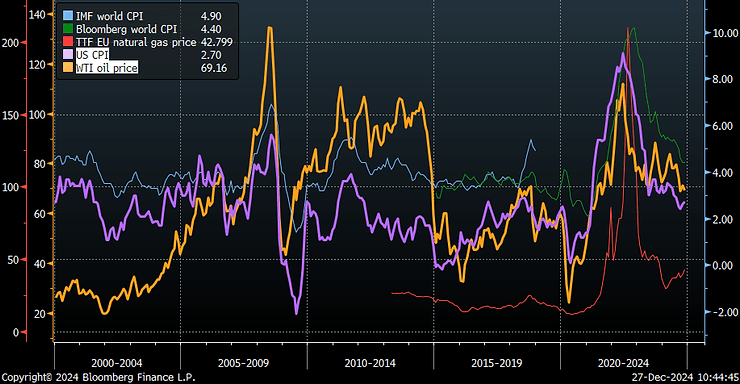
Global inflation declines. Absent of another forced closure of global manufacturing, 8% of GDP new fiscal impulse (both hardly possible), and (most importantly) energy shocks, inflation is set to decline further from here. Long term bond yields fall globally.
Inflation is closely linked to energy prices and usually moves in the same direction: shocks in 2008, 2014 and 2022 – are all interconnected, not just in the US, but globally too.
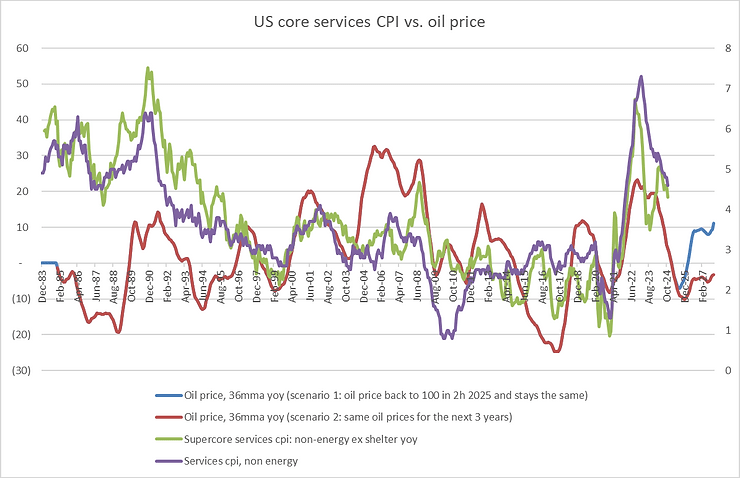
And oil/natural gas prices are not just part of headline CPI, but are important contributors to non-energy services ex-shelter CPI too. Energy plays a key role in services like transportation (air tickets), recreation (restaurants, beauty saloons), accommodation (hotels or short term rentals). In a scenario when oil prices stays the same for the next 3 years at $70/bbl, services CPI should be trending down. Unless oil jumps back above $100, the risk of the second wave of inflation is minimal.
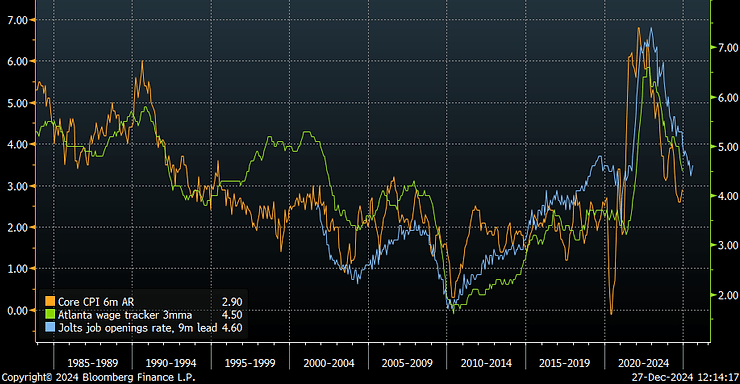
US wages, another potential source of inflation, are slowing down further, but are still above pre-Covid averages. However, US economy remains in the extended cycle top, and labor market will continue to soften.
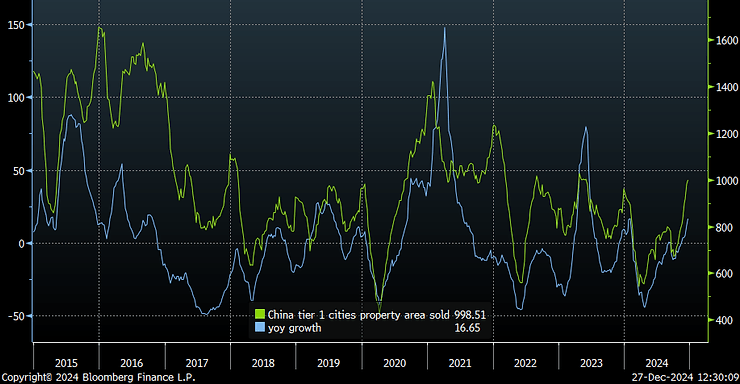
Chinese economy is starting to pick up and perform better than expected, as consumer confidence rebuilds, economic stimulus spreads. China remains strong in car manufacturing, semiconductors, AI, energy technologies. Equities perform well next year.
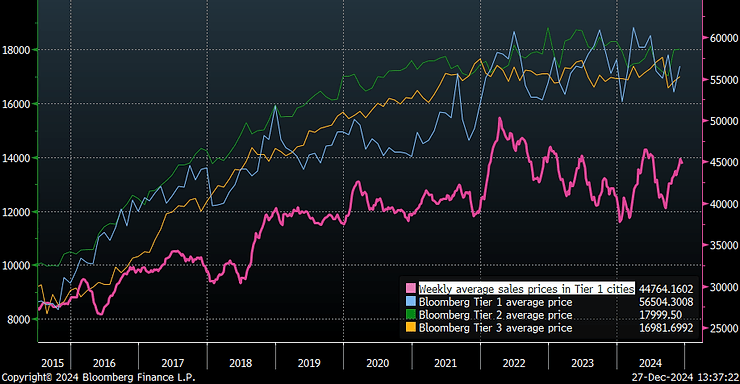
Property sales in tier 1 cities are rising.
While supply of built properties is declining.
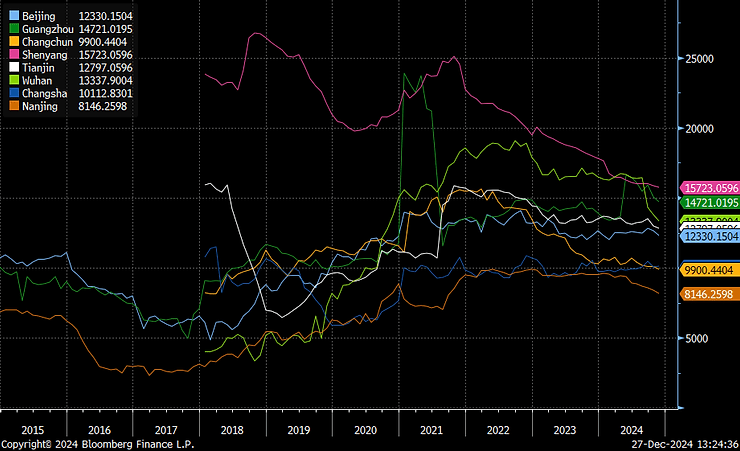
Aggregate weekly house values stopped declining.
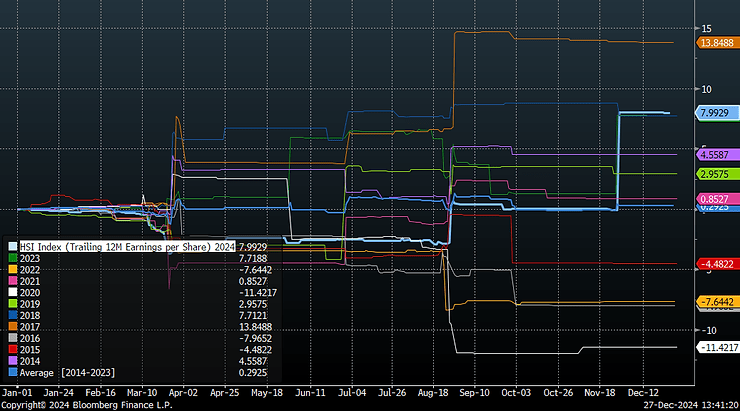
Corporate earnings are improving. HSI trailing 12m EPS is up 8% year-to-date.
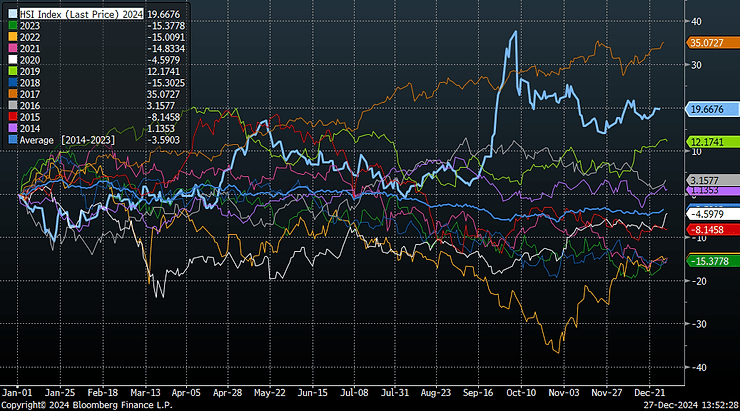
Equity market performance was also very strong compared to the last 10 years.
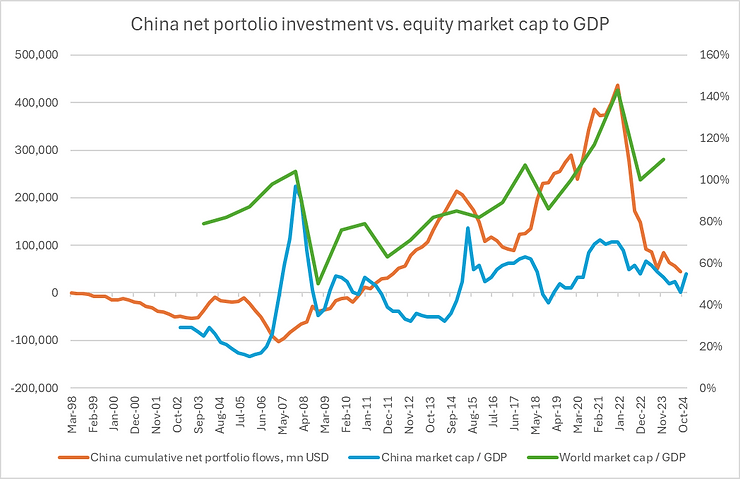
Net portfolio flows out of China have been negative since the end of 2021. Similarly China market cap to GDP peaked during the same period. It now stands at around 55%, compared to 110% of global market cap to GDP ratio. China is significantly underowned, while government is prepared to stimulate internal demand and the main source of deflation, property market, is showing signs of bottoming.
Defaults will get too costly to ignore: credit risk will jump.
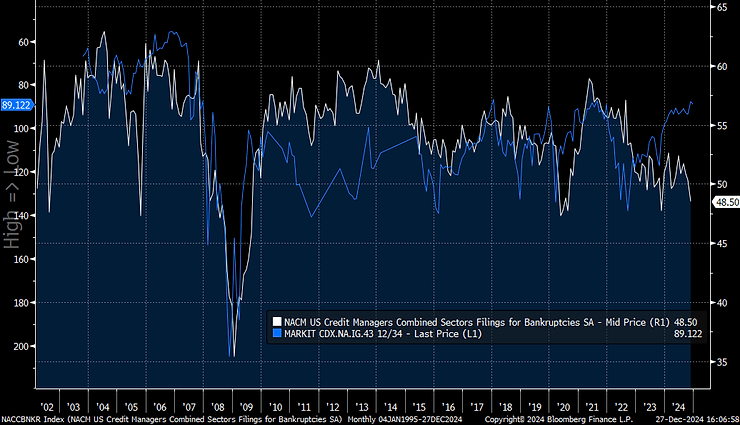
Defaults are rising in various parts of the world and asset classes, while credit risk premium remains too complacent. Leveraged loans defaults and distressed exchanged are rising towards four year highs, as rates stay restrictive. And despite looser credit standards.
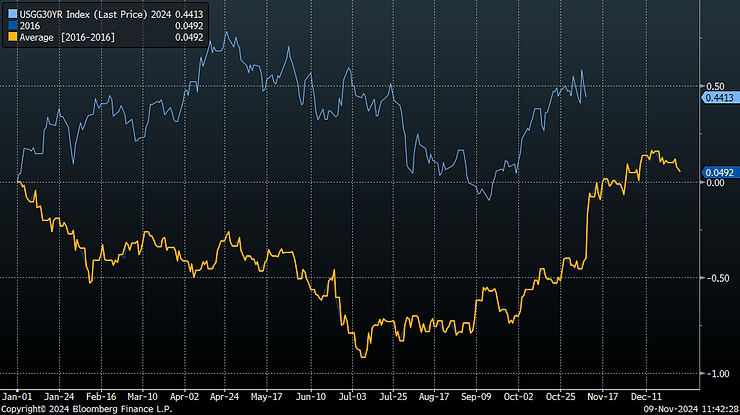
Trump trade so far is diverging from 2016 analogy. At the moment most markets see much smaller incremental policy change compared to 2016. On top of that, rates stay restrictive enough to slow the economy further: demand, employment, margins, inflation – are all softening.
Bonds aren’t selling off post elections, despite large intraday volatility on the election date. 30-year yields are basically flat in the last 2 weeks.
Dollar strengthens less than in 2016 too (percent change ytd).